TeamViewer DEX
Experience Analytics

TeamViewer DEX
Combine endpoint analytics and software monitoring data with direct sentiment feedback from end-users to see the complete picture of their digital employee experience. Spot IT issues faster, understand end-user perceptions of IT, deepen your digital empathy, and increase employee productivity.
Experience Analytics provides experience scores and analytics for performance, responsiveness, stability, network, and boot-ups.
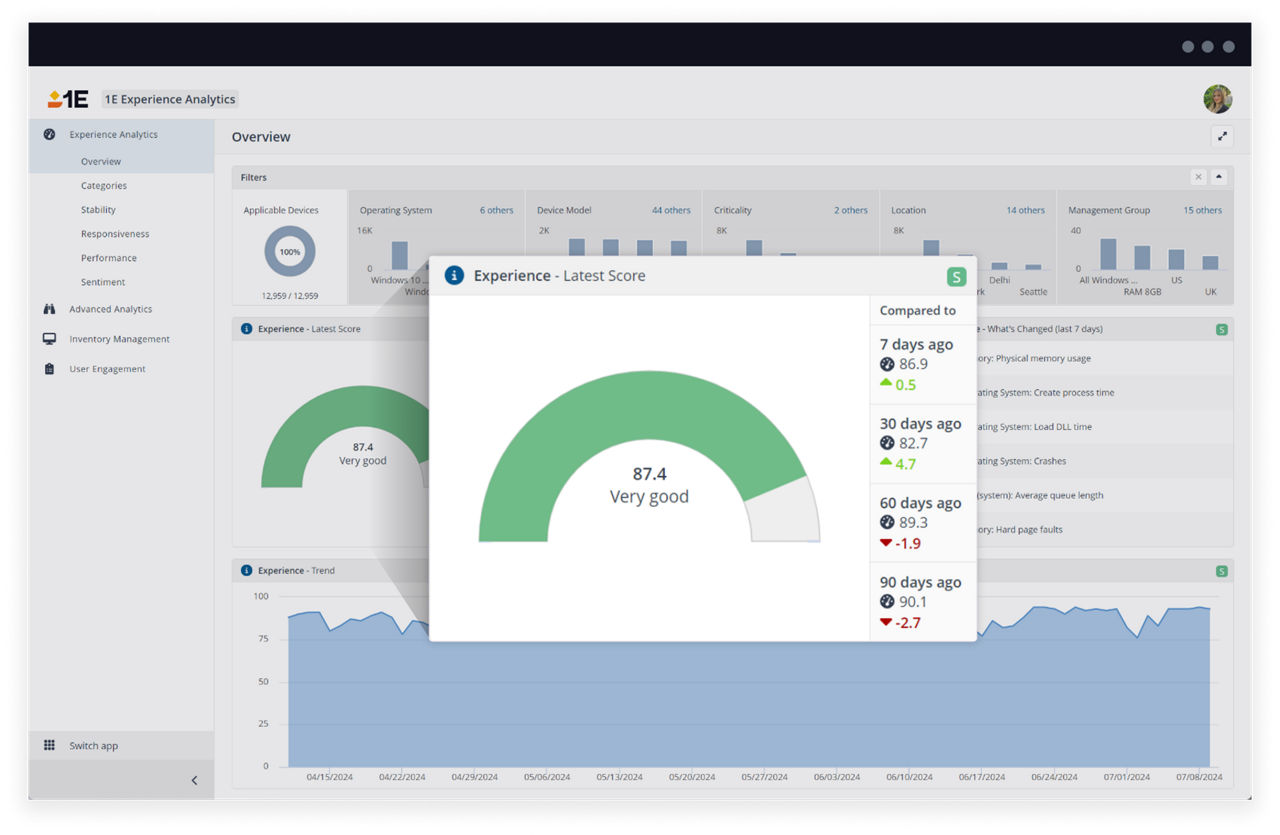
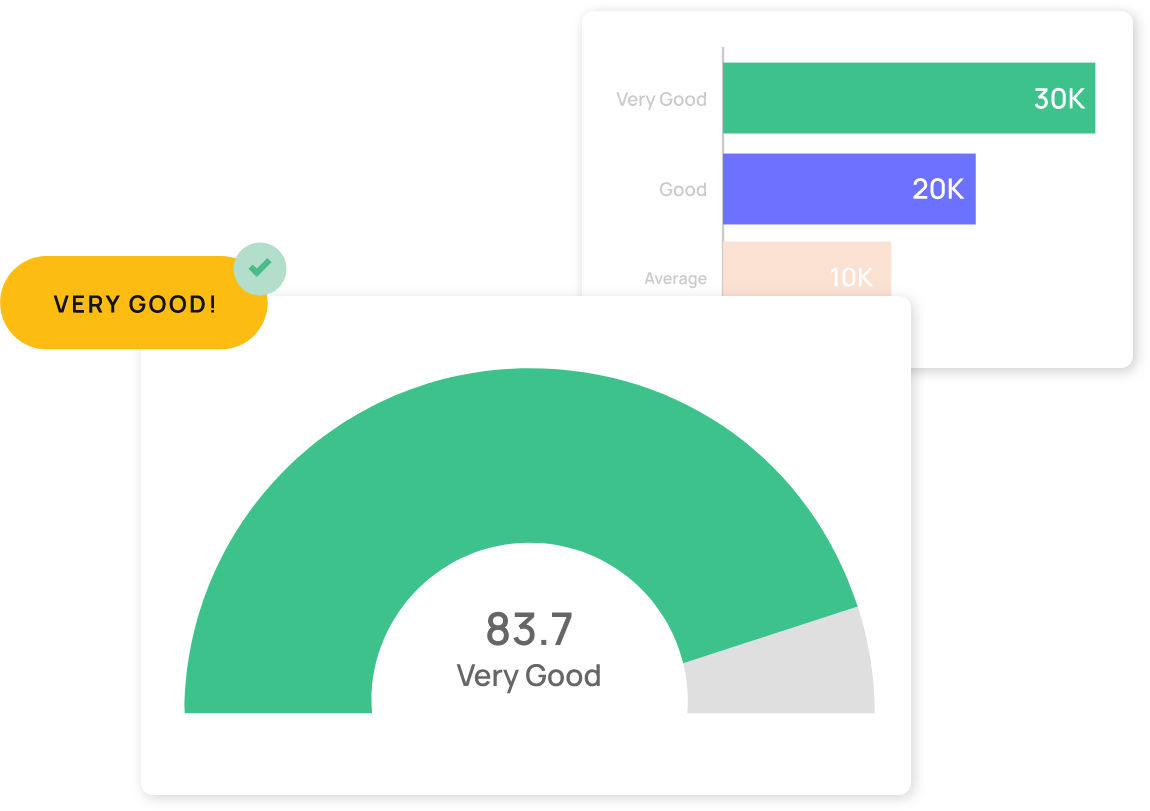
Get a global view of your company's digital employee experience. Segment by group or hardware type and drill-down to understand the end-user computing factors driving great (and not so great) experiences. Data from four categories determine your score: stability, responsiveness, performance, and sentiment.
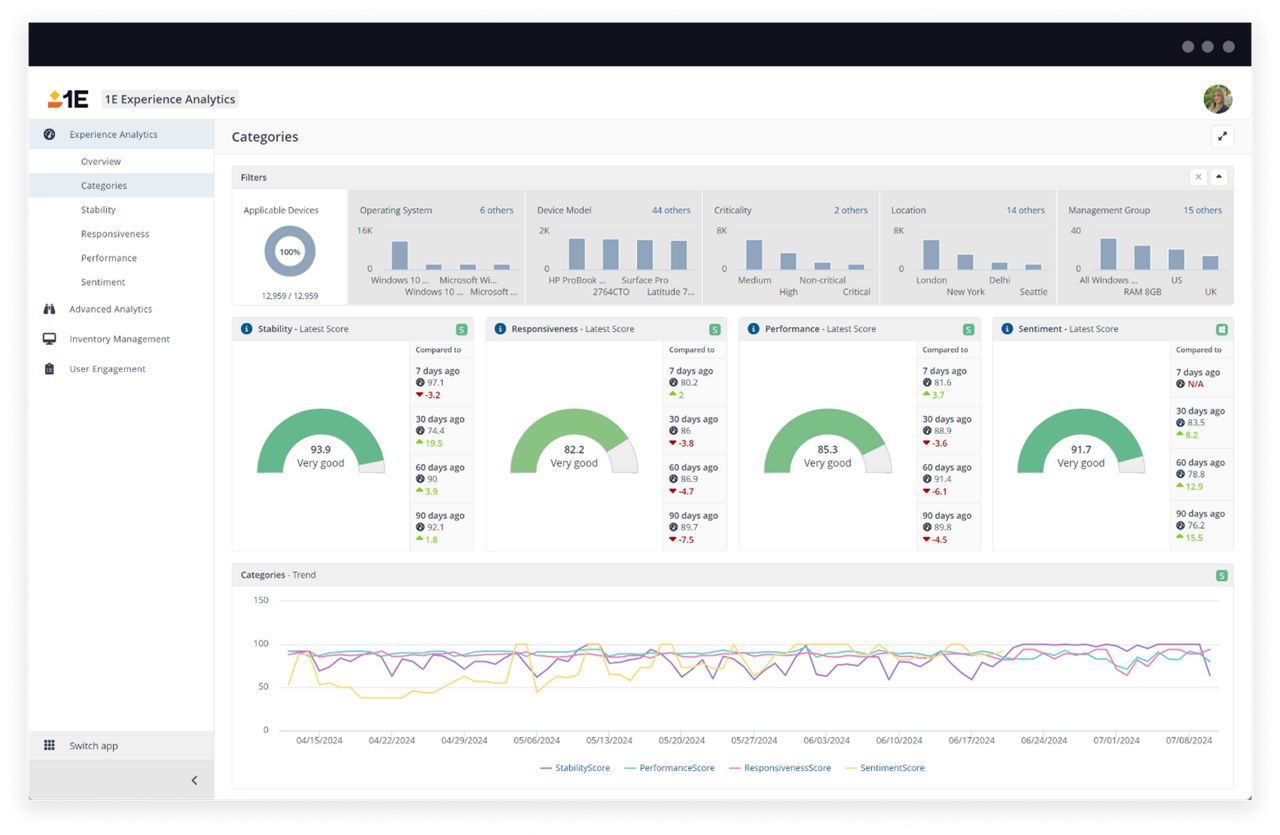
Visualize performance, responsiveness, and stability metrics across your IT estate in a single dashboard. Get granular with details on disk, CPU, memory percentages, and bandwidth. Use synthetic transactions to gauge endpoint sluggishness and crashiness. Easily view historical trends and make helpful comparisons.
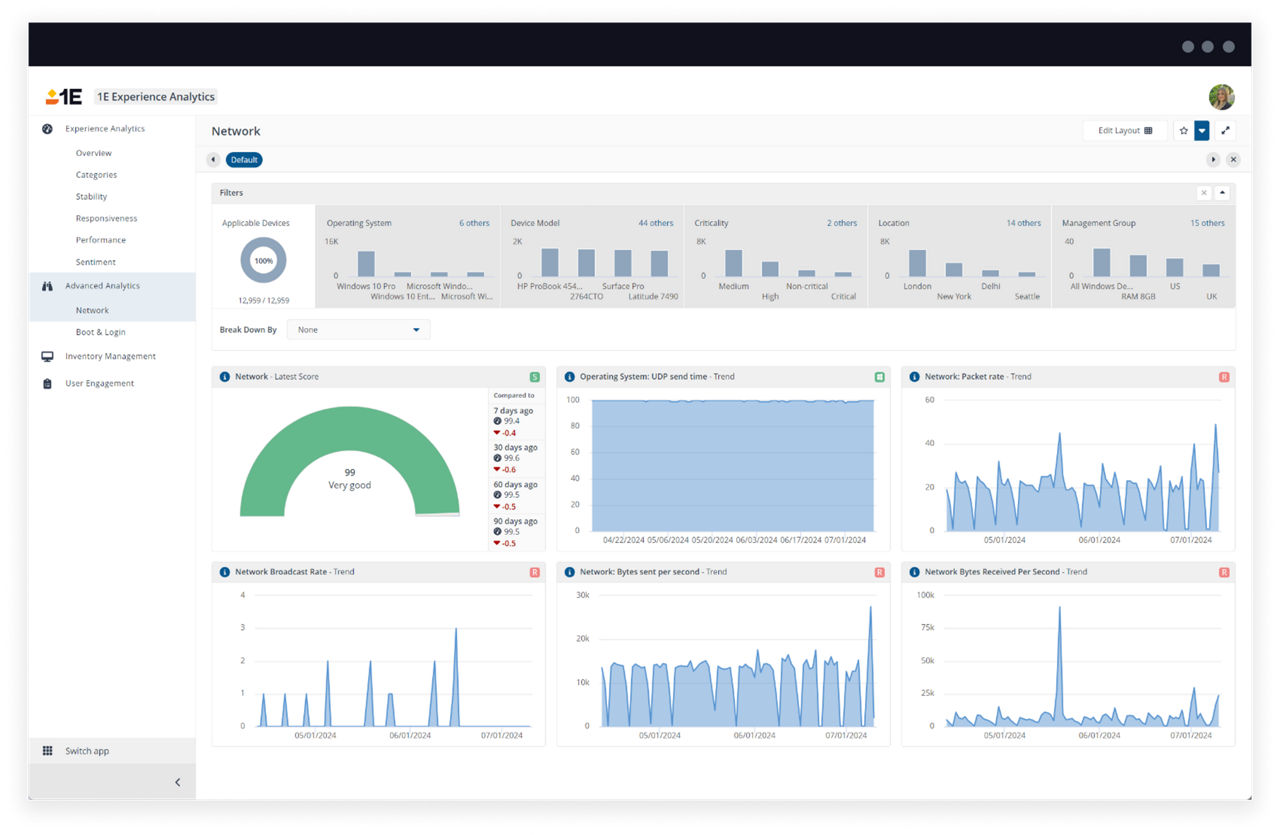
Highlight and troubleshoot digital workplace issues using special diagnostic screens dedicated to WiFi problems, network connectivity issues, and slow boot-up times.
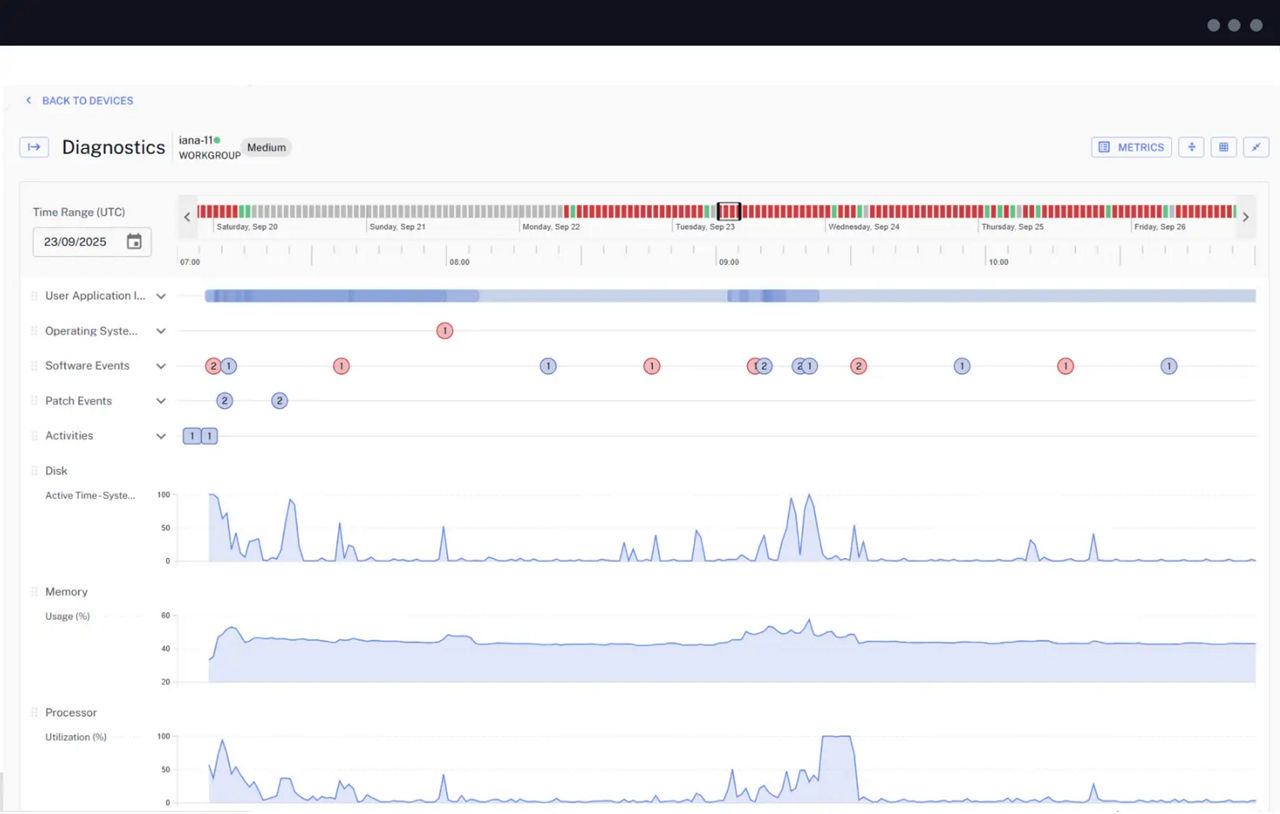
Gain deep visibility into endpoint performance. Access 14 days of device history alongside real-time insights to validate issues, uncover trends, and accelerate troubleshooting. Diagnostics reduces resolution times, improves user experience, and enables proactive IT support.
Discover how TeamViewer ONE improves productivity and lowers costs.
TeamViewer ONE features may vary by license and are subject to change.