TeamViewer ONE introduces a redesigned navigation experience for both Standard and Advanced users. The new navigation replaces a fragmented, feature-centric structure with a use-case-based navigation, organizing the product around the key tasks you perform every day. This optimization makes it faster and more intuitive to manage your IT environment from end to end.
This article applies to all Standard and Advanced TeamViewer ONE customers.
What has changed?
The new sidebar navigation organizes TeamViewer ONE around four clearly defined sections, each focused on a specific part of your IT workflow. Instead of hunting across separate menu items, everything you need for a given task is grouped in one place.
The sidebar remembers its collapsed or expanded state between sessions. When collapsed, hovering over a section reveals its sub-items without requiring you to expand the full menu.

The new navigation sections
TeamViewer ONE's new navigation experience is broken down into four sections: Manage, Resolve, Measure, and Automate.
- Manage
- Resolve
- Automate
- Measure
Manage
Your central hub for day-to-day device operations. From here, you can access your devices, review vulnerabilities and patches, respond to alerts, and run automation workflows, all from one place. Manage is broken down into three sections: Devices, Alerts, and Assets.

- Devices
- Alerts
- Assets
Devices
TeamViewer ONE previously spread device information across several separate sections of the product. Depending on what you needed to check, be it alerts, patches, protection status, or backup coverage, you had to navigate to a different area each time. The Devices section brings all of that together. From a single page, you can switch between focused device views using a dropdown selector, without losing your place or navigating away. There are five available views: Devices, Alerts, Patches, Protection, and Backup.
- Default view
- Alerts view
- Patches view
- Protection view
- Backup view
Default view
Your full list of all managed devices.
The default view provides a centralized overview of all devices managed through TeamViewer ONE. From this screen, you can start a remote session, verify whether a device is online, view its TeamViewer ID, and access additional management actions that mirror the familiar TeamViewer Remote workflow.

Alerts view
Device-level alert and monitoring information for your fleet.
Here you’ll find real‑time insights into the condition of every device you manage. This includes active alerts, system health metrics, and other monitoring signals that help you spot problems early and take action before they impact your environment.

Patches view
Patch and asset management data per device, showing which devices need attention.
The Patches view section provides a clear breakdown of each device’s patch status and installed assets. You can quickly identify which devices are missing important updates, require maintenance, or show indicators that they may be at risk. By highlighting devices that need attention, this view helps you prioritize patching tasks and maintain a secure, fully updated environment.

Protection view
Protection status across your managed devices
The Protection view provides an at‑a‑glance summary of the security posture of each device in your environment. You can review which devices are fully protected, which may require action, and where potential risks have been identified. This helps you quickly assess overall security health and address issues before they impact your fleet.

Backup view
Backup coverage and status per device
Note: The Backup view is available only to TeamViewer ONE customers with the Backup add-on.
The Backup view shows whether each device in your environment is fully archived and whether recent backups have completed successfully. You can quickly see which devices are covered, which may be missing backups, and where attention is needed to ensure your data remains safe and recoverable.

Alerts
The Alerts section serves as your central workspace for investigating active issues as they arise. It shows alerts generated from individual devices, along with context that helps you understand what triggered them and how urgent they are. From here, you can drill into specific alerts, review additional details, and take immediate corrective action, all without switching to another part of the product. This streamlined view helps you respond quickly and maintain awareness of emerging problems across your environment.
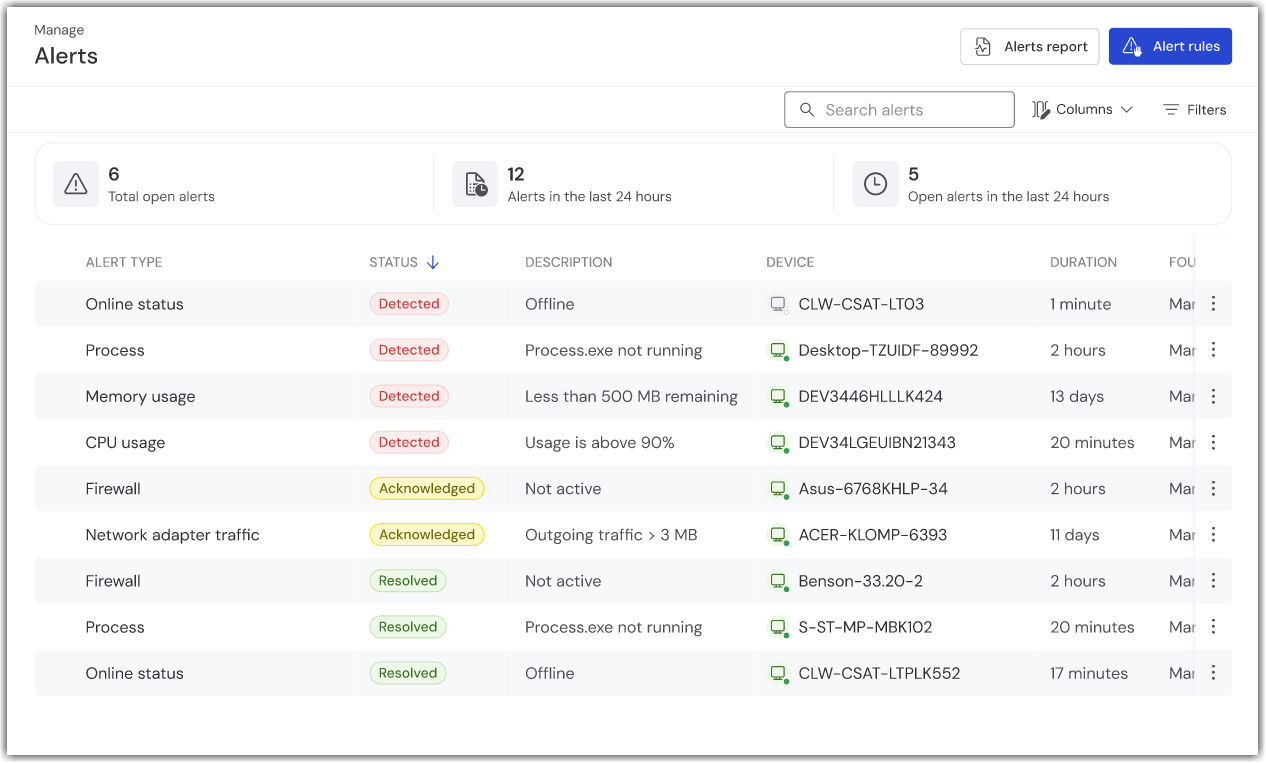
Previously known as TeamViewer Monitoring, this is where you can review active alerts, investigate their root cause, and take action, without switching to a separate area of the product.

Additional views for TeamViewer Endpoint Detection and Response customers
TeamViewer Endpoint Detection & Response customers also receive three additional Alerts views: Detection, Quarantine, and Suspicious activity.
- Detection view
- Quarantine view
- Suspicious activity view
Detection view
The Detection view lets you review all current threats on your devices and their status, making it easier to prioritize devices that require your attention. The Detection view helps you quickly identify which devices need immediate attention while maintaining visibility across your entire environment.

Quarantine view

Suspicious activity view
With the Suspicious activity view, you can monitor potentially malicious behavior by reviewing activity related to processes, the registry, the file system, and network connections. The dashboard brings this information together to help you quickly identify activity that requires attention.

Assets
Note: Assets is available only for TeamViewer ONE Advanced customers.
The Assets section provides a consolidated view of the software, updates, and known vulnerabilities across your devices. It helps you understand the current state of each system by showing patch status, identifying outstanding vulnerabilities, and prioritizing remediation efforts. It also provides a complete rundown of both software and hardware assets for your fleet.
From this unified view, you can assess exposure, prioritize remediation tasks, and make informed decisions to improve the overall security and compliance posture of your device fleet, and all from a single, focused view within Manage.
Resolve
Your dedicated space for support and issue resolution.
This area serves as the central hub for managing technical issues reported within your environment. It gives your support team a complete view of incoming requests, ongoing investigations, and resolved items, all organized to help track progress from the moment an issue is detected through to final closure.
The Resolution Center and Remote Support are grouped here, consolidating case activity in one place. Your team can stay organized, respond quickly, and maintain clear oversight of open and historical issues, from detection to closure.
- Resolution Center
- Remote Support
Resolution Center
The Resolution Center provides structured visibility into all cases raised across your organization, separating open and closed cases into dedicated views. Each case includes key details such as status, severity, impact, and category, allowing your support team to gauge urgency and understand the nature of the issue at a glance. This layout helps streamline triage, track case progression, and ensure that nothing falls through the cracks.

Remote Support
Your complete Remote Support toolkit, now accessible from within your case workflow.
Remote Support provides the same capabilities you may already know from TeamViewer Remote. All core functions remain available, only the location in the interface has changed.

Automate
A focused area for workflow automation.
Automate provides a centralized workspace for configuring and managing automated processes across your environment. From here, you can create, edit, and organize Scripts as well as manage DEX Essentials scripting tasks, all from a single, streamlined location.
By bringing your automation tools together, this view eliminates the need to navigate through multiple areas of the product, making it easier to deploy actions, maintain consistency, and scale your workflows efficiently.
Measure
A unified view of your environment’s performance and health
Measure brings together key insights that help you understand how your overall environment is performing. Instead of looking at data device by device, this view consolidates high‑level trends, activity patterns, and operational health indicators so you can evaluate the stability, efficiency, and usage of your entire setup at a glance.
It provides the context you need to monitor the environment holistically and make informed decisions that support ongoing performance and reliability.
Measure consolidates all your Dashboards, so you always have the data you need to make informed decisions.
Benefits for you
Less time navigating, more time acting
Use‑case‑based navigation groups the actions most relevant to a task into one place, allowing you to move through your daily workflows with fewer clicks and less friction. Instead of switching between menus to find what you need, each section is organized around a clear purpose, helping you take action faster and stay focused on resolving issues and managing your environment.
This streamlined navigation model helps you stay focused on what matters most: taking action quickly and keeping your environment running smoothly.
A complete picture of your devices
The unified Devices page provides a comprehensive view of each device’s overall health, eliminating the need to jump between multiple areas to understand its status. A single page displays patch levels, alerts, backup coverage, and other key details, and a simple view selector lets you switch perspectives as needed.
This makes it easier to assess device readiness, spot issues quickly, and maintain consistency across your fleet.
Consistent and intuitive language
The updated terminology for Alerts and Alert rules aligns feature names with the way IT teams naturally describe monitoring and detection workflows. This clearer, more intuitive language reduces ambiguity for new users and shortens onboarding time.
With terminology that matches industry expectations, users can understand capabilities at a glance and find what they need without second‑guessing which feature performs which function.